What is happening?
Scoping (MfE Step 1: Preparation and Context)
The project’s scoping phase focused on the collection of existing data, data and policy review, compartmentalisation of the coast (see "Coastal assets") and methodology development. It included initial stakeholder and community engagement, establishing the project’s governance framework and undertaking the first pass risk assessment (see "What matters most?") to identify those locations predicted to be at the greatest, or most immediate, risk from coastal hazards.
The Scoping Report summarised existing information and identified future engagement, assessment and other work requirements for adaptation planning, providing a ‘route map’ for the next phases of the project. It should be noted, however, that the approach to the project has evolved since the Scoping Report was drafted. For example, rather than producing (say four) shoreline management plans, the project has provided coastal adaptation strategies for unique sections of the coast. These changes are reflected herein.
The Coastal Environment Baseline Report describes the characteristics of the Coromandel Peninsula’s existing environment, including the geology and topography, physical processes (wind, tides, waves etc.), storm events, geomorphology, shoreline change (including coastal protection), cultural context and natural environment.
Hazard mapping (MfE Step 2: Hazard and SLR Assessments)
Three coastal hazard assessment exercises were undertaken as part of the project:
-
Coastal inundation hazard (CIH) assessment
-
Coastal erosion hazard (CEH) assessment.
-
Cliff and slope instability hazard assessment.
CIH assessment
The methodology adopted for the CIH assessment is set out in detail in the CIH Methodology Report.
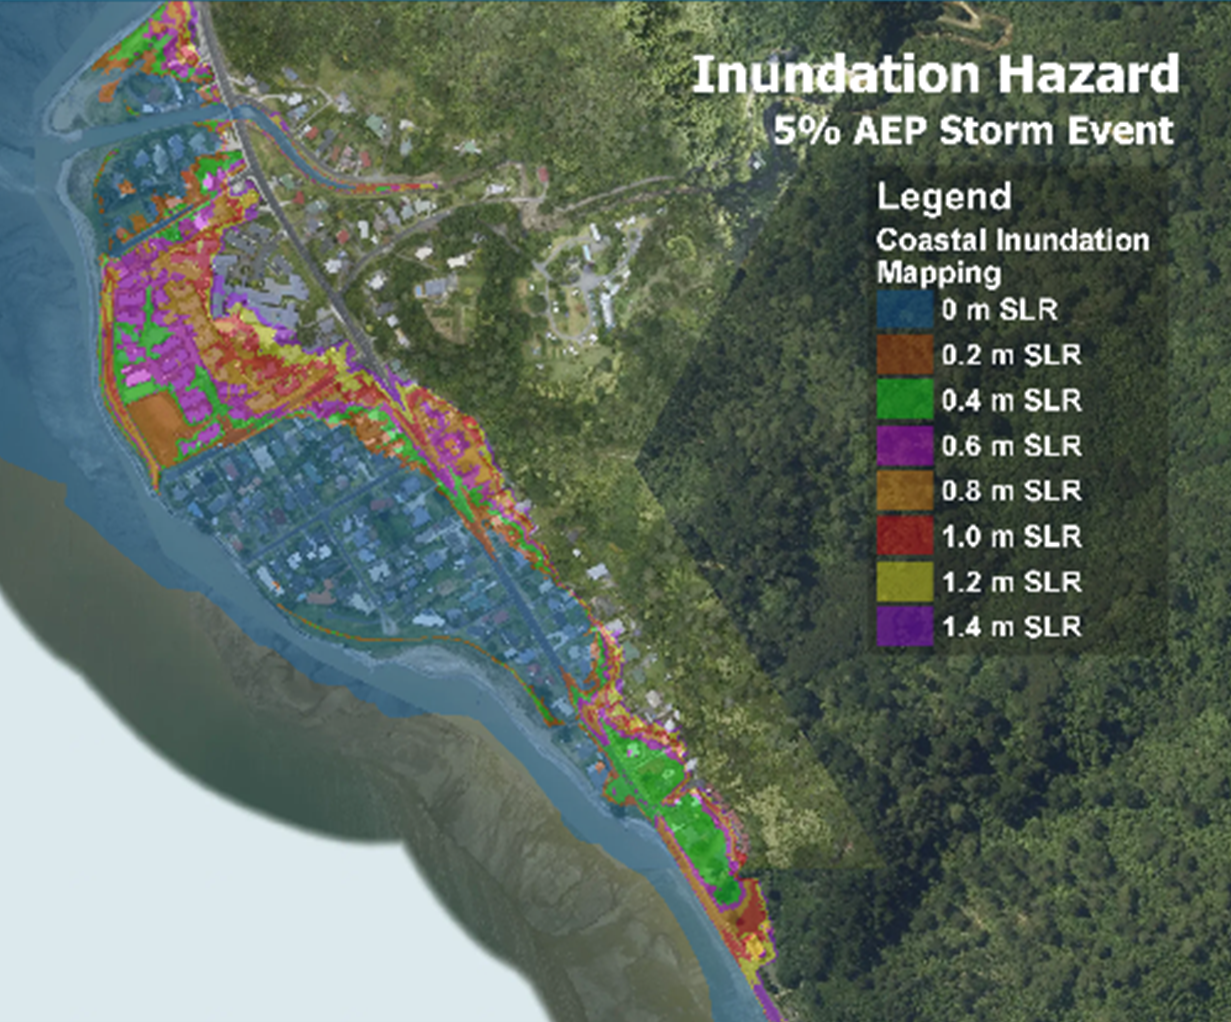
Based on the results of the first pass risk assessment, coastal inundation hazard modelling was undertaken for locations (‘management areas’) where this hazard was identified as posing potentially significant risk (see figure below).

Modelling produced interactive hazard maps that show the predicted extent of inundation associated with 0.2m increments of SLR (from 0m[1] up to 1.4m) for King Tides, a 5% annual exceedance probably (AEP)[2] storm event[3] and a 1% AEP[4] storm event[5].
CEH assessment
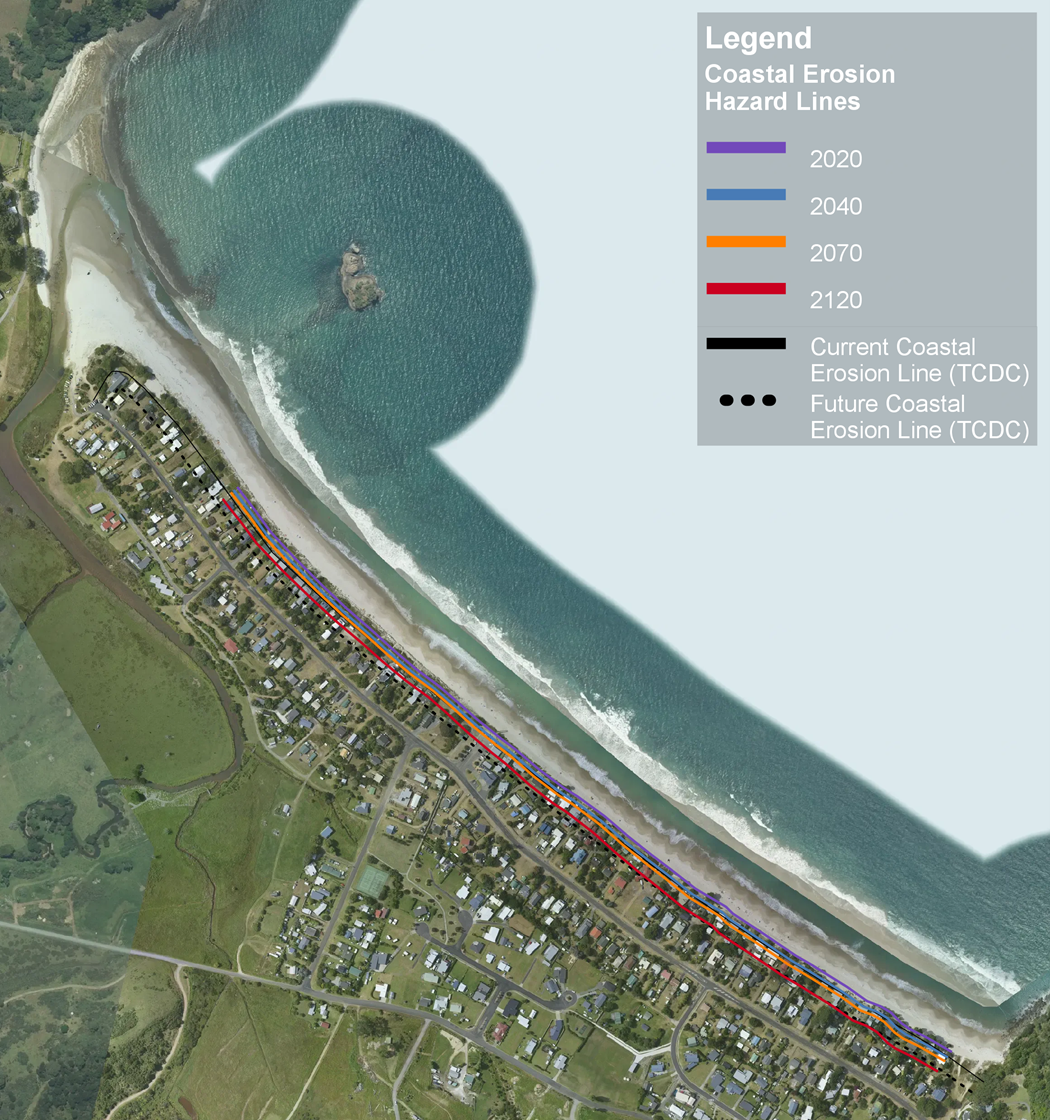
Based on the results of the first pass risk assessment, probabilistic coastal erosion hazard modelling was undertaken for beaches where the hazard risk was identified as being potentially significant and a record of beach profile data was available. Modelling was completed for Kuranui Bay, Tararu, Ngarimu Bay, Thornton Bay, Te Puru, Waiomu, Te Mata, Tapu, Waikawau, Oamaru, Waitete Bay, Papa Aroha, Colville Bay on the west coast, and Kennedy Bay Beach, Whangapoua, Matarangi, Wharekaho, Ohuka, Buffalo Beach, Cooks Beach, Ocean Beach Tairua, Pauanui and Whangamata (north and south) on the east coast.
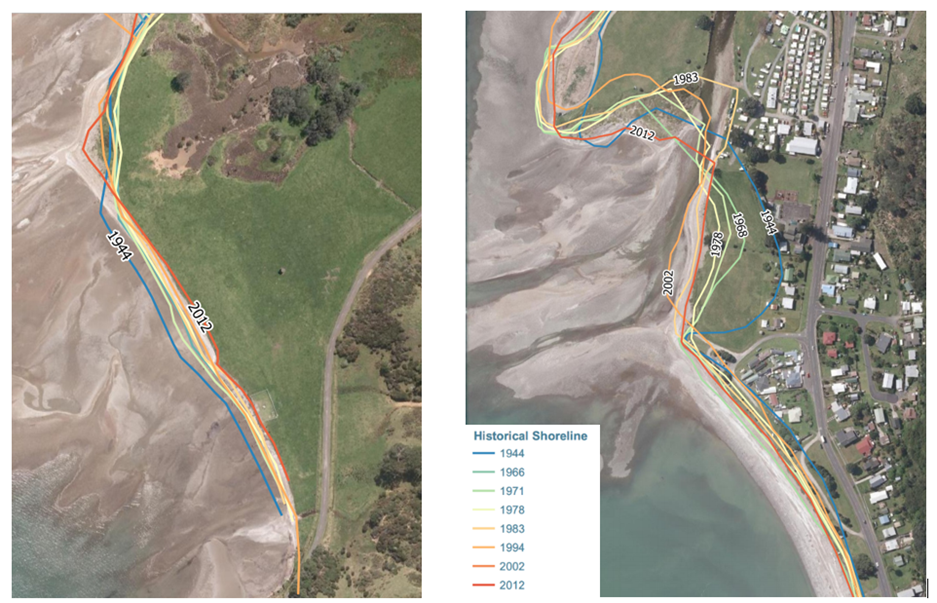
This produced hazard maps that show the predicted erosion hazard line associated with a 1% AEP storm event in 2020, 2040, 2070 and 2120 (see predicted erosion map below), and presented historic shorelines (see "Appendix B of the Coastal Environment Baseline Report") where this information is available (see mapped shoreline images below).
The methodology adopted for the CEH assessment is set out in detail in a CEH Methodology Report.
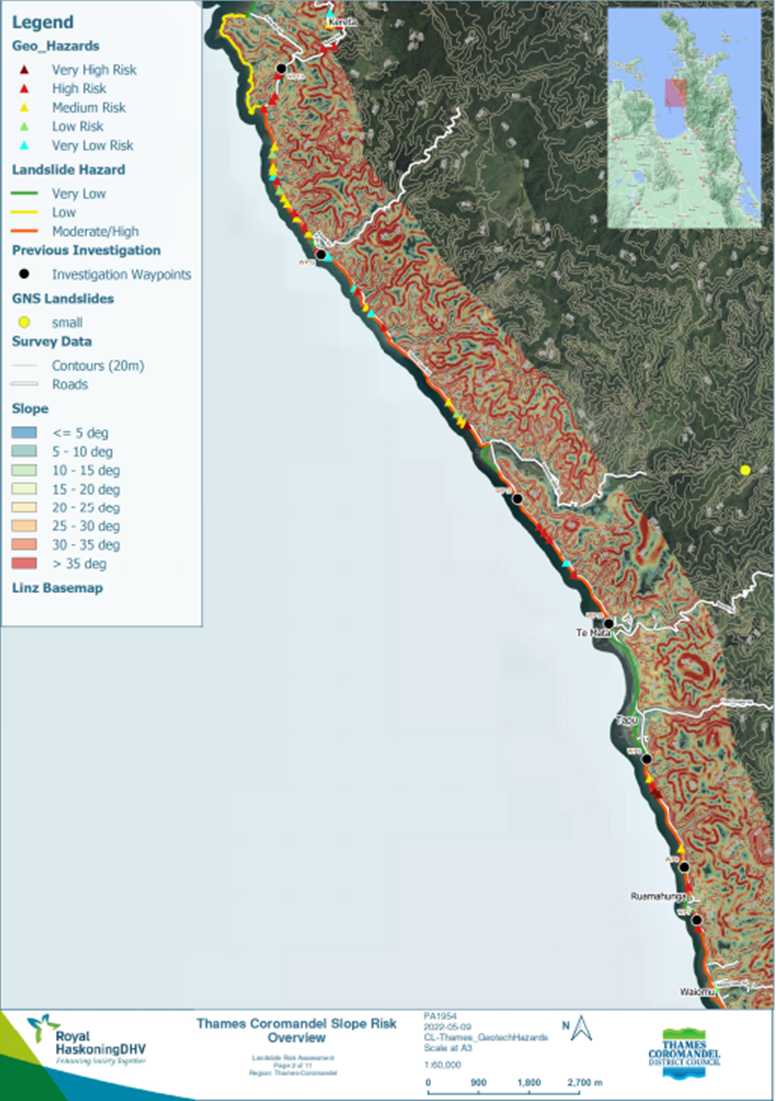
Cliff and slope instability assessment
High-level characterisation of cliff and slope instability hazards was undertaken for the whole of the Peninsula’s coastline and mapped (see "Appendix 1 of the Cliff and Slope Instability Hazard Report"). Like the hazard maps for coastal inundation and erosion, this information was used to inform the development of CAPs in response to the assessed risk (see figure below).
The methodology adopted for the landslide assessment is set out in a Cliff and Slope Instability Hazard Report.
Other information
Other information used to inform the development of the CAPs included a coast protection asset inventory, information on the past storm events, land elevation changes, further investigations into specific stretches of coast where data gaps were evident (e.g., Kennedy Bay and Kuaotunu), groundwater in Thames, and data on contaminated sites (or potentially contaminated sites).
Footnotes
- 1 The modelling was undertaken in 2020, which is the baseline year for TCDC’s 100-year coastal adaptation planning process, but the starting water level for SLR (i.e., 0m SLR) was derived from Stephens et. al. (2015) based on a detailed analysis of mean high water spring (MHWS) tide levels across the Peninsula (see Section 5.2.1 of the CIH assessment methodology) <link to CIH Methodology>.
- 2 With a 5% probability of occurring in any one year.
- 3 Under current conditions the frequency of such a storm event roughly equates to a 20-year event (with climate change such events are predicted to become more frequent).
- 4 With a 1% probability of occurring in any one year.
- 5 Under current condition the frequency of such a storm event roughly equates to a 100-year event.