How do we get it done?
Adaptation Pathways (MfE Step 7: Adaptive Planning Strategy)
Based on consultation with local communities and review of the principles, objectives and expressed values (natural – access – beach – environment), the draft CAPs were refined. In most cases, to produce the refined pathways intervention options not advocated (or not preferred) were deselected and further detail was added relating to the action proposed (see image below). From this, a proposed adaptation pathway was derived.
In some cases, adaptation choices remain on the adaptation pathway (i.e., where more information is required to inform a decision and particularly when the decision relates to the more distant future). This is the case for Whitianga, where the risk associated with inundation in the longer term is predicted to be significant. There is broad acceptance in this case that Whitianga should be protected from flooding but, equally, a desire for the beach to be maintained for as long as possible and flexibility relating to what to protect.
The next step required the definition of:
-
Thresholds – where it was determined that the hazard or risk would no longer be tolerable (would be intolerable); indicated on a coastal adaption pathway by a vertical line (|).
-
Triggers – an indicator for action, i.e., sufficiently in advance of a tolerance threshold being reached, a new course of action needed to be implemented (or a decision need be to be taken); indicated on a CAP by a rectangle (followed by a circle, i.e., a transfer point). Triggers can take many forms, including physical or spatial triggers (e.g., storm events, rates of erosion or SLR), societal triggers (e.g., withdrawal of insurance cover or demand for action) and temporal triggers (e.g., driven a planning timeframe[1]).
-
Signals – an indicator raising awareness that a trigger/decision-point is approaching, and that further investigation is required, or the planning process should be initiated; indicated on a CAP by a triangle. As for triggers, signals can take many forms, including physical or spatial signals, societal signals and temporal signals.
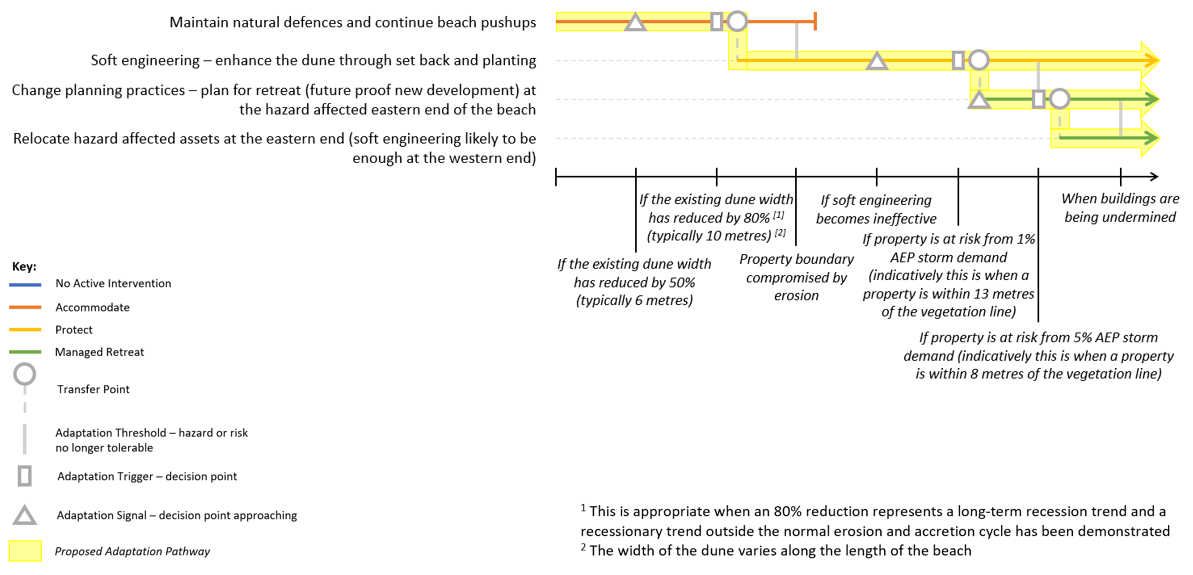
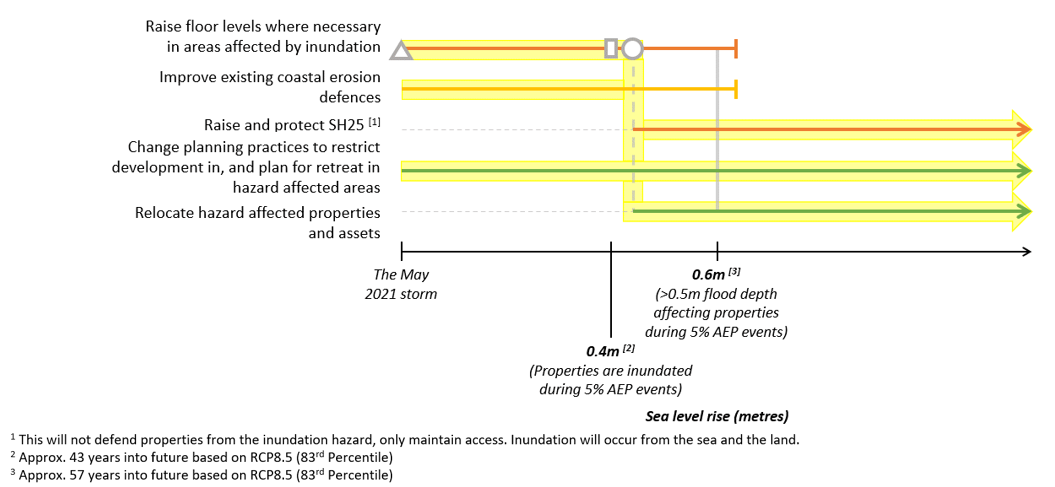
Thresholds, signals and triggers are detailed on the x-axis of the of the adaptation pathway (where adaptation actions are detailed on the y-axis) and vary based on the nature of the hazards and the risks posed by them (where in "Refined draft coastal adaptation pathway for Whangapoua Beach" action is driven by erosion and in "Refined draft coastal adaptation pathway for Ohuka (Brophys Beach)" action is driven by a storm event and inundation).
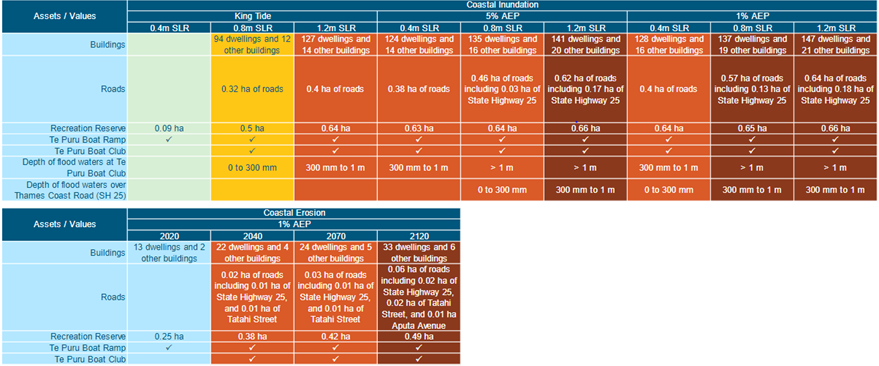
For each action, the adaptation threshold (defined based on various factors, including intolerable risk) was defined first and then triggers and signals were proposed. Where the risk of coastal inundation was driving the adaptation pathway, decisions relating to what was tolerable and intolerable were informed by the data included in the risk assessment (relating to what was at risk in different circumstances) and information on the predicted depth and frequency of inundation (see table below).
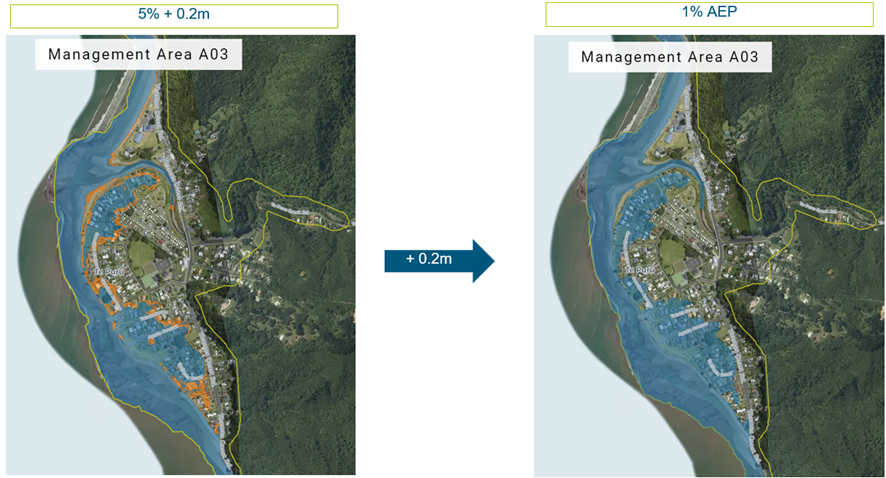
The relationship between the frequency (predicted AEP) of an event and changes in exposure with SLR was also considered. That is, the data provided in the figure below shows predicted exposure depths for Te Puru South and the predicted area of influence of a 5% AEP storm event plus 0.2m of SLR, and how this will equate to the predicted area of influence of a 1% AEP storm event now (in other words, with 0.2m of SLR a so-called 1-in-20-year storm will “feel like” a 1-in-100-year storm under current conditions; and with 1m of SLR a King Tide will have the same influence as a 1-in-20-year event now, three times a year).
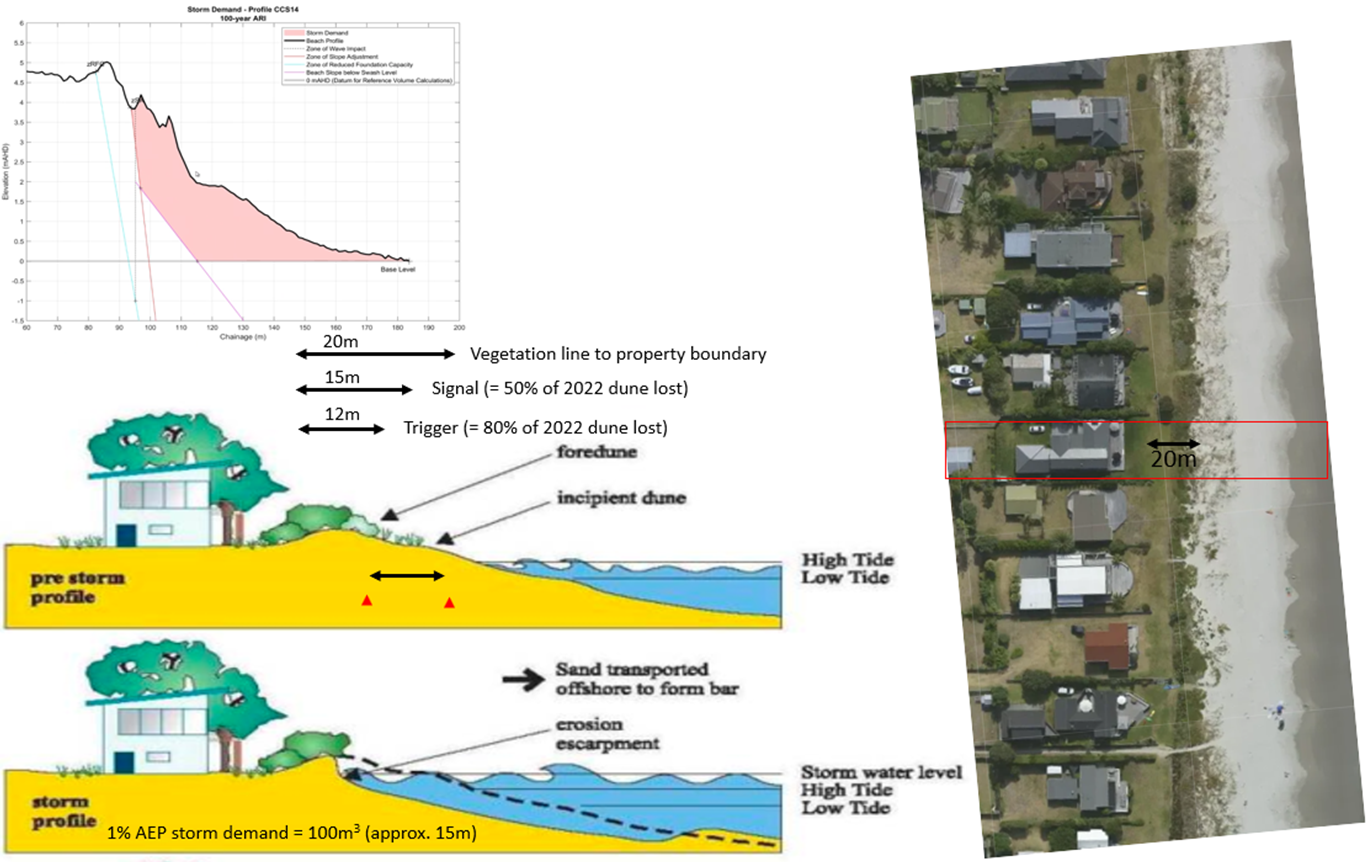
Where coastal erosion was driving the adaptation pathway, information on the average width of the dune, the average distance of the vegetation line to property boundaries/properties, and the 1% AEP storm demand were used to define triggers and signals for action (and/or further investigation); see "Data used to derive thresholds, triggers and signals relating to coastal erosion, Matarangi" figure below. In this context, it is notable that adaptation thresholds relating to instigating soft engineering (e.g., setting back the dunes into the recreation reserve, where possible[2]), or protection more generally (where typically action will be sought early[3]), are different to those relating to a need to retreat (when assets are threatened). In the case of retreat, the risk appetite of individuals becomes more relevant and the trigger to act is likely to be delayed for as long as possible.
Coastal adaptation pathways
From all the above, refined preferred CAPs were prepared and described for the whole of the coastline of the Coromandel Peninsula. The output was 138 unique CAPs[4]. In each case, the following is provided:
-
A description of the stretch of coast covered by the CAP.
-
Maps showing the location of the policy unit and the predicted hazards.
-
A summary of the output from the risk assessment.
-
A summary of the adaptation options assessed.
-
The recommended adaptation pathway itself.
-
An adaptation strategy.
Consultation on the draft CAPs was undertaken with the Coastal Panels, the TAG, the public (through consultation events in June 2022) and the project’s Governance Committee. The feedback received is reflected in the final versions of the CAPs.
Footnotes
- 1 Such as an infrastructure renewal period or the timeframe required for design and build in advance of a tolerance threshold being reached.
- 2 Where space is available.
- 3 But should not be taken unless a recessionary trend outside the normal cycle of erosion and accretion has been demonstrated.
- 4 There are 141 Policy Units, but one was split into two (i.e., Kopu and Rhodes Park) and others were combined (e.g., Coville Bay and Estuary).